Demand Schedule and Demand Curve and Why Demand Curve Slopes Downward to the Right?
Demand Schedule
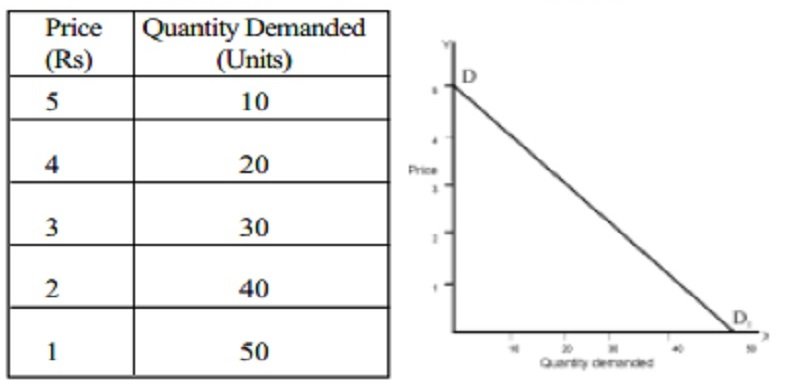
The demand schedule is the list of different quantities demanded of a commodity that buyers would purchase at different prices.
| Price per unit (Tk) | Quantity demanded (Kg) |
| 40 | 20 |
| 35 | 25 |
| 30 | 30 |
| 25 | 35 |
| 20 | 40 |
Demand Curve
The demand curve indicates the different quantities of a commodity at different prices. The graphical representation of the demand schedule is called the demand curve. The demand curve simply shows how the quantity purchased varies with the variation in price.

Along the OX axis are represented the quantities of the commodity and along the OY axis represents the prices. It will be seen that at the price OP, OM quantity is purchased. At OP’ price, ON quantity is purchased and at OP” price. OL Quantity is purchased.
Why Demand Curve Slopes Downward to the Right?
Generally demand curve slopes downwards. When the price falls of the commodity, the demand rises and if the price rises, the demand falls off the commodity. There are three reasons for the demand curve to be sloped downward to the right.
- Law of diminishing marginal utility
- Income effect
- Substitute effect
1. Income effect If the price falls, the real income of the purchaser increases. When the price low for a commodity, less price is spent for the previous amount of the commodity, and surplus money is spent for an additional unit of the commodity. If the price rises, the real income decreases, and so on.
2. Substitute effect Remaining prices unchanged of other commodities, if the price falls of a commodity, demand increases. Because the goods are cheaper than other goods due to the price fall of the commodity.
Less urgent use: When a commodity becomes cheaper like water, we shall use it for washing, and other less urgent uses.
Exceptions:
- In the future price of a commodity may increase
- Honour, dignity
- Gifted goods